The problem
When creating 2D contour line plots, it is often needed to also label
the contour lines. Matplotlib has a built-in clabel() function for such purposes, e.g.
cs = ax.contour(X, Y, Z)
cs.clabel(fontsize=12, inline=1, fmt='%.2f')
The inline=1 keyword tells the function to break up a contour line
to create room for the label text. An example of such type of
labeling is given in Figure 1a below:
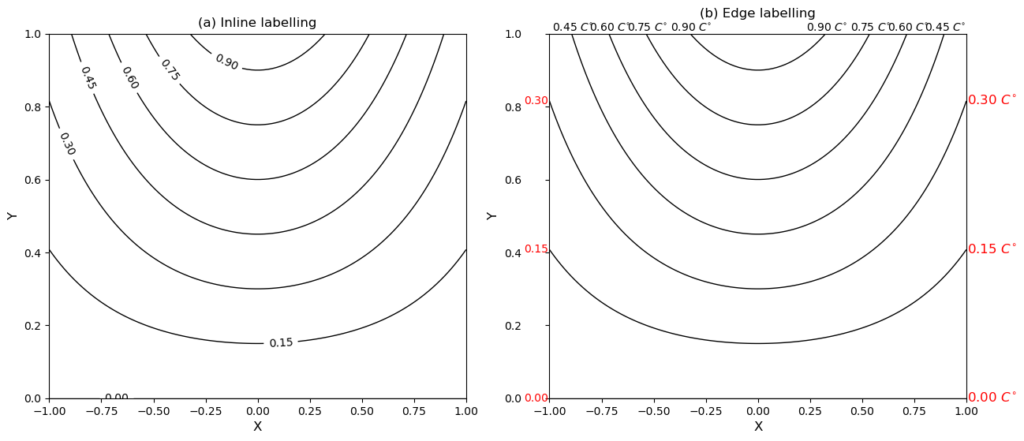
However, there are cases when the contour lines mostly intersect with the plot boundaries, and it will make the plot cleaner to label them at the edges, rather than inside the plot. This post provides a solution for such a task.
The solution
Code first:
def labelAtEdge(levels, cs, ax, fmt, side='both', pad=0.005, **kwargs):
    '''Label contour lines at the edge of plot

    Args:
        levels (1d array): contour levels.
        cs (QuadContourSet obj): the return value of contour() function.
        ax (Axes obj): matplotlib axis.
        fmt (str): formating string to format the label texts. E.g. '%.2f' for
            floating point values with 2 demical places.
    Keyword Args:
        side (str): on which side of the plot intersections of contour lines
            and plot boundary are checked. Could be: 'left', 'right', 'top',
            'bottom' or 'all'. E.g. 'left' means only intersections of contour
            lines and left plot boundary will be labeled. 'all' means all 4
            edges.
        pad (float): padding to add between plot edge and label text.
        **kwargs: additional keyword arguments to control texts. E.g. fontsize,
            color.
    '''

    from matplotlib.transforms import Bbox
    collections = cs.collections
    xlim = ax.get_xlim()
    ylim = ax.get_ylim()
    bbox = Bbox.from_bounds(xlim[0], ylim[0], xlim[1]-xlim[0], ylim[1]-ylim[0])

    eps = 1e-5  # error for checking boundary intersection

    # -----------Loop through contour levels-----------
    for ii, lii in enumerate(levels):

        cii = collections[ii]  # contours for level lii
        pathsii = cii.get_paths()  # the Paths for these contours
        if len(pathsii) == 0:
            continue

        for pjj in pathsii:

            # check first whether the contour intersects the axis boundary
            if not pjj.intersects_bbox(bbox, False):  # False significant here
                continue

            xjj = pjj.vertices[:, 0]
            yjj = pjj.vertices[:, 1]

            # intersection with the left edge
            if side in ['left', 'all']:
                inter_idx = np.where(abs(xjj-xlim[0]) <= eps)[0]
                for kk in inter_idx:
                    inter_x = xjj[kk]
                    inter_y = yjj[kk]

                    ax.text(inter_x-pad, inter_y, fmt % lii,
                            ha='right',
                            va='center',
                            **kwargs)

            # intersection with the right edge
            if side in ['right', 'all']:
                inter_idx = np.where(abs(xjj-xlim[1]) <= eps)[0]
                for kk in inter_idx:
                    inter_x = xjj[kk]
                    inter_y = yjj[kk]

                    ax.text(inter_x+pad, inter_y, fmt % lii,
                            ha='left',
                            va='center',
                            **kwargs)

            # intersection with the bottom edge
            if side in ['bottom', 'all']:
                inter_idx = np.where(abs(yjj-ylim[0]) <= eps)[0]
                for kk in inter_idx:
                    inter_x = xjj[kk]
                    inter_y = yjj[kk]

                    ax.text(inter_x-pad, inter_y, fmt % lii,
                            ha='center',
                            va='top',
                            **kwargs)

            # intersection with the top edge
            if side in ['top', 'all']:
                inter_idx = np.where(abs(yjj-ylim[-1]) <= eps)[0]
                for kk in inter_idx:
                    inter_x = xjj[kk]
                    inter_y = yjj[kk]

                    ax.text(inter_x+pad, inter_y, fmt % lii,
                            ha='center',
                            va='bottom',
                            **kwargs)

    return
Using the function to label the same set of contours in Figure 1a, but at the left, top and right edges:
cs = ax2.contour(X, Y, Z, levels, colors='k', linewidths=1)
labelAtEdge(levels, cs, ax2, r'%.2f $C^{\circ}$', side='top', pad=0.005)
labelAtEdge(levels, cs, ax2, r'%.2f $C^{\circ}$', side='right', pad=0.005,
            color='r', fontsize=12)
labelAtEdge(levels, cs, ax2, '%.2f', side='left', pad=0.005,
            color='r', fontsize=10)
The result is shown in Figure 1b.
More explanations
The default clabel() function doesn’t provide such functionality. To
achieve this, we will need to get the coordinates of the contour
lines, and detect boundary intersections manually.
The contour coordinates are a bit hidden inside the return value of
the contour() function. Let’s get there step by step. The
cs.collections attribute is a collection of contour objects, each
corresponding to a contour level. Therefore we first make a loop
through the contour levels, and for each level, obtain the contour collections:
for ii, lii in enumerate(levels):
	cii = collections[ii]  # contours for level lii
Note that some specific levels may not have any corresponding contours (this can happen when you demand a contour level outside of the value range of the data). This is checked by querying the length of the path list:
pathsii = cii.get_paths()  # the Paths for these contours
if len(pathsii) == 0:
	continue
Here, pathsii is a list of Path objects, the elements of which
are iterated through next: for pjj in pathsii.
Intersection with the plot boundaries is checked using the
intersects_bbox() method of pjj. The boundaries are represented by
a bounding box object, created from the axes limits:
bbox = Bbox.from_bounds(xlim[0], ylim[0], xlim[1]-xlim[0], ylim[1]-ylim[0])
Upon intersection, contour coordinates are finally obtained from the Path object:
xjj = pjj.vertices[:, 0]
yjj = pjj.vertices[:, 1]
Then, for each of the 4 sides, intersection locations are obtained, using the x/y coordinates. For instance, intersection with the left boundary implies an overlap of one x- coordinate with the lower limit of the x-axis:
if side in ['left', 'all']:
    inter_idx = np.where(abs(xjj-xlim[0]) <= eps)[0]
    for kk in inter_idx:
        inter_x = xjj[kk]
        inter_y = yjj[kk]
We used a tolerance of eps here, instead of plain equality operator ==,
to avoid possible issues with numerical errors.
Lastly, a text label is added at each intersection point, with a
padding added to make the text more readable. The formatting string
fmt, and additional formatting keyword arguments are applied here:
ax.text(inter_x-pad, inter_y, fmt % lii,
        ha='right',
        va='center',
        **kwargs)
The similar process is repeated for the right, bottom and top boundaries. Note that for different edges, the sign of the padding value, the horizontal/vertical alignment options are also changed accordingly, so that the label texts are always outside of the plotting area.
Some additional notes:
Since these label texts are now put outside of the plotting area, you may want to add an extra padding to the axis tick labels to avoid overlaps, as in the case of Figure 1b. This can be achieved using, for instance,
ax2.tick_params(axis='y', pad=22)
ax2.set_title('(b) Edge labelling', pad=15)
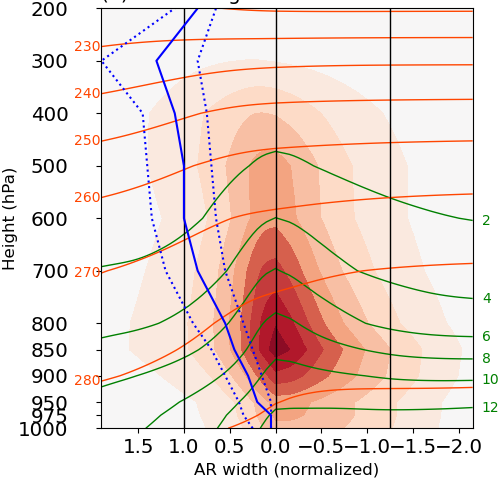
A real-world example
Figure 2 below shows the application of such edge-labeling in a real-world example. What is displayed is the cross-sectional vertical profile of a typical atmospheric river (AR). The horizontal direction measures the width of the AR, in normalized units. The vertical axis is the height dimension, measured in hPa.
I’m ignoring the detailed description of the plot. Only pay attention to the green contours, showing the specific humidity (in g/kg) distribution, and the orange contours, denoting the pattern of vertical temperature variation, measured in K. These contour lines are labeled at the right and left edges, respectively, using the same technique introduced above.
Complete code
Complete script to generate Figure 1:
import numpy as np
from tools import functions, plot

def labelAtEdge(levels, cs, ax, fmt, side='both', pad=0.005, **kwargs):
    '''Label contour lines at the edge of plot

    Args:
        levels (1d array): contour levels.
        cs (QuadContourSet obj): the return value of contour() function.
        ax (Axes obj): matplotlib axis.
        fmt (str): formating string to format the label texts. E.g. '%.2f' for
            floating point values with 2 demical places.
    Keyword Args:
        side (str): on which side of the plot intersections of contour lines
            and plot boundary are checked. Could be: 'left', 'right', 'top',
            'bottom' or 'all'. E.g. 'left' means only intersections of contour
            lines and left plot boundary will be labeled. 'all' means all 4
            edges.
        pad (float): padding to add between plot edge and label text.
        **kwargs: additional keyword arguments to control texts. E.g. fontsize,
            color.
    '''

    from matplotlib.transforms import Bbox
    collections = cs.collections
    xlim = ax.get_xlim()
    ylim = ax.get_ylim()
    bbox = Bbox.from_bounds(xlim[0], ylim[0], xlim[1]-xlim[0], ylim[1]-ylim[0])

    eps = 1e-5  # error for checking boundary intersection

    # -----------Loop through contour levels-----------
    for ii, lii in enumerate(levels):

        cii = collections[ii]  # contours for level lii
        pathsii = cii.get_paths()  # the Paths for these contours
        if len(pathsii) == 0:
            continue

        for pjj in pathsii:

            # check first whether the contour intersects the axis boundary
            if not pjj.intersects_bbox(bbox, False):  # False significant here
                continue

            xjj = pjj.vertices[:, 0]
            yjj = pjj.vertices[:, 1]

            # intersection with the left edge
            if side in ['left', 'all']:
                inter_idx = np.where(abs(xjj-xlim[0]) <= eps)[0]
                for kk in inter_idx:
                    inter_x = xjj[kk]
                    inter_y = yjj[kk]

                    ax.text(inter_x-pad, inter_y, fmt % lii,
                            ha='right',
                            va='center',
                            **kwargs)

            # intersection with the right edge
            if side in ['right', 'all']:
                inter_idx = np.where(abs(xjj-xlim[1]) <= eps)[0]
                for kk in inter_idx:
                    inter_x = xjj[kk]
                    inter_y = yjj[kk]

                    ax.text(inter_x+pad, inter_y, fmt % lii,
                            ha='left',
                            va='center',
                            **kwargs)

            # intersection with the bottom edge
            if side in ['bottom', 'all']:
                inter_idx = np.where(abs(yjj-ylim[0]) <= eps)[0]
                for kk in inter_idx:
                    inter_x = xjj[kk]
                    inter_y = yjj[kk]

                    ax.text(inter_x-pad, inter_y, fmt % lii,
                            ha='center',
                            va='top',
                            **kwargs)

            # intersection with the top edge
            if side in ['top', 'all']:
                inter_idx = np.where(abs(yjj-ylim[-1]) <= eps)[0]
                for kk in inter_idx:
                    inter_x = xjj[kk]
                    inter_y = yjj[kk]

                    ax.text(inter_x+pad, inter_y, fmt % lii,
                            ha='center',
                            va='bottom',
                            **kwargs)

    return


# -------------Main---------------------------------
if __name__ == '__main__':

    # ----------------Prepare some data----------------
    x = np.linspace(-1, 1, 100)
    y = np.linspace(0, 1, 100)
    X, Y = np.meshgrid(x, y)

    Z = np.exp(-X**2) * Y

    # -------------------Plot------------------------
    import matplotlib.pyplot as plt
    from matplotlib.pyplot import MaxNLocator

    figure = plt.figure(figsize=(15, 6), dpi=100)
    locator = MaxNLocator(nbins='auto')
    levels = locator.tick_values(np.min(Z), np.max(Z))

    # inline labelling
    ax1 = figure.add_subplot(1, 2, 1)
    cs = ax1.contour(X, Y, Z, levels,
                     colors='k',
                     linewidths=1)
    cs.clabel(fontsize=10, inline=1, fmt='%.2f')
    ax1.set_xlabel('X', fontsize=12)
    ax1.set_ylabel('Y', fontsize=12)
    ax1.set_title('(a) Inline labelling')

    ax2 = figure.add_subplot(1, 2, 2)

    # edge labelling
    cs = ax2.contour(X, Y, Z, levels,
                     colors='k',
                     linewidths=1)
    labelAtEdge(levels, cs, ax2, r'%.2f $C^{\circ}$', side='top', pad=0.005)
    labelAtEdge(levels, cs, ax2, r'%.2f $C^{\circ}$', side='right', pad=0.005,
                color='r', fontsize=12)
    labelAtEdge(levels, cs, ax2, '%.2f', side='left', pad=0.005,
                color='r', fontsize=10)

    ax2.tick_params(axis='y', pad=22)
    ax2.set_xlabel('X', fontsize=12)
    ax2.set_ylabel('Y', fontsize=12)
    ax2.set_title('(b) Edge labelling', pad=15)
    figure.show()