The issue
Often when we create a matplotlib figure with multiple subplots, we might need to give a separate colobar for each subplot. Depending on the layout, figure size and the plotted data, we can choose to turn off the x-/y- axis tick labels for the interior-located subplots , and let the subplots on the same column/row to share the same set of tick labels. In such cases, there will be some extra empty space left-over between the plotting area and the colorbar, and it will be a waste of the valuable real estate of the figure if such spaces are not utilized, as shown in the 1st row of Figure 1 below:
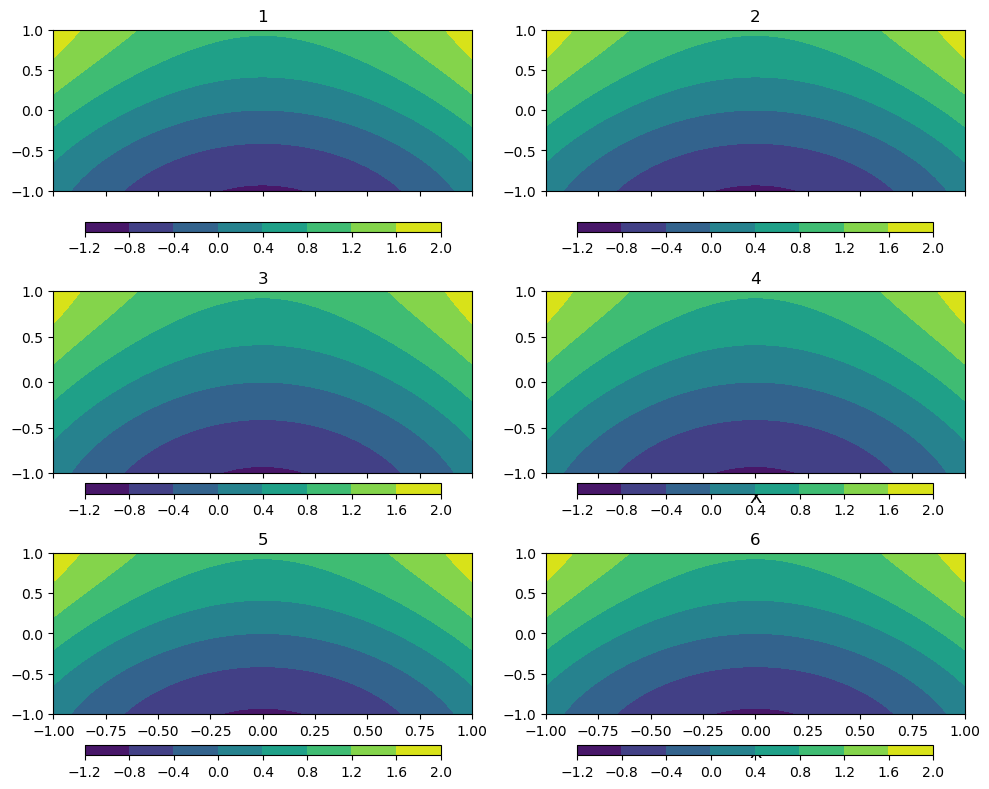
To shrink down that empty space, we can set a smaller pad number
for the colorbar axis creation function, like so:
cax, kw = mcbar.make_axes_gridspec(ax, orientation='horizontal',
                                   pad=0.05,
                                   fraction=0.07, shrink=0.85, aspect=35)
The default value of pad for a horizontal colorbar is 0.15, we
make it 0.05 for the 2nd row of the subplots in Figure 1, to get a
more compact layout. When the tick labels are turned on, set a larger
value pad=0.15 to make room for the label texts, as shown in the 3rd
row of Figure 1.
However, this is using hard-coded padding values (0.15 v.s. 0.05),
which won’t adjust well to the existence of the x-labels, like in the
case of Figure 1(4) and Figure 1(6). Overlaps also tend to happen
when the figure size changes.
The solution
This solution is adapted and modified from this Stackoverflow answer, so due credit to its author.
Code first:
def getColorbarPad(ax, orientation, base_pad=0.0):
    '''Compute padding value for colorbar axis creation

    Args:
        ax (Axis obj): axis object used as the parent axis to create colorbar.
        orientation (str): 'horizontal' or 'vertical'.
    Keyword Args:
        base_pad (float): default pad. The resultant pad value is the computed
            space + base_pad.
    Returns:
        pad (float): the pad argument passed to make_axes_gridspec() function.
    '''

    # store axis aspect
    aspect = ax.get_aspect()
    # temporally set aspect to 'auto'
    ax.set_aspect('auto')
    # get renderer
    renderer = ax.get_figure().canvas.get_renderer()
    # get the bounding box of the main plotting area of axis
    b1 = ax.patch.get_extents()
    # get the bounding box the axis
    b2 = ax.get_tightbbox(renderer)
    if orientation == 'horizontal':
        # use the y-coordinate difference as the required pad, plus a base-pad
        bbox = ax.transAxes.inverted().transform([b1.p0, b2.p0])
        pad = abs(bbox[0]-bbox[1])[1] + base_pad
    elif orientation == 'vertical':
        # use the x-coordinate difference as the required pad, plus a base-pad
        bbox = ax.transAxes.inverted().transform([b1.p1, b2.p1])
        pad = abs(bbox[0]-bbox[1])[0] + base_pad
    # restore previous aspect
    ax.set_aspect(aspect)

    return pad
The complete script to create a new figure using the proposed solution:
import numpy as np
import matplotlib.pyplot as plt
import matplotlib.colorbar as mcbar

def getColorbarPad(ax, orientation, base_pad=0.0):
    '''Compute padding value for colorbar axis creation

    Args:
        ax (Axis obj): axis object used as the parent axis to create colorbar.
        orientation (str): 'horizontal' or 'vertical'.
    Keyword Args:
        base_pad (float): default pad. The resultant pad value is the computed
            space + base_pad.
    Returns:
        pad (float): the pad argument passed to make_axes_gridspec() function.
    '''

    # store axis aspect
    aspect = ax.get_aspect()
    # temporally set aspect to 'auto'
    ax.set_aspect('auto')
    # get renderer
    renderer = ax.get_figure().canvas.get_renderer()
    # get the bounding box of the main plotting area of axis
    b1 = ax.patch.get_extents()
    # get the bounding box the axis
    b2 = ax.get_tightbbox(renderer)
    if orientation == 'horizontal':
        # use the y-coordinate difference as the required pad, plus a base-pad
        bbox = ax.transAxes.inverted().transform([b1.p0, b2.p0])
        print(bbox)
        pad = abs(bbox[0]-bbox[1])[1] + base_pad
    elif orientation == 'vertical':
        # use the x-coordinate difference as the required pad, plus a base-pad
        bbox = ax.transAxes.inverted().transform([b1.p1, b2.p1])
        pad = abs(bbox[0]-bbox[1])[0] + base_pad
    # restore previous aspect
    ax.set_aspect(aspect)

    return pad


if __name__ == '__main__':

    # create sample data
    x = np.linspace(-2, 2, 100)
    y = np.linspace(-1, 1, 50)
    X, Y = np.meshgrid(x, y)
    Z = X**2+np.sin(Y)

    # plot subplots
    figure = plt.figure(figsize=(10, 8))
    nrow = 4
    ncol = 2

    for ii in range(nrow*ncol):

        ax = figure.add_subplot(nrow, ncol, ii+1)
        row, col = np.unravel_index(ii, (nrow, ncol))
        cs = ax.contourf(X, Y, Z)

        # plot x label at bottom row
        if row != nrow-1:
            ax.set_xticklabels([])
        else:
            ax.tick_params(labelsize=16)

        # add xlabel would need more padding
        if row == 1 and col == 1:
            ax.set_xlabel('X')
        if row == 2 and col == 1:
            # use larger font size
            ax.set_xlabel('X', fontsize=15)

        pad=getColorbarPad(ax, 'horizontal')
        cax, kw = mcbar.make_axes_gridspec(ax, orientation='horizontal',
                                           pad=pad,
                                           fraction=0.07, shrink=0.85, aspect=35)
        figure.colorbar(cs, cax=cax, orientation='horizontal')
        ax.set_title(str(ii+1))

    figure.tight_layout()
    figure.show()
The resultant figure is given in Figure 2 below. Here we are making it a bit more challenging by creating 4 rows, and making some texts extra large. It can be seen that the solution creates just enough padding space for different scenarios.
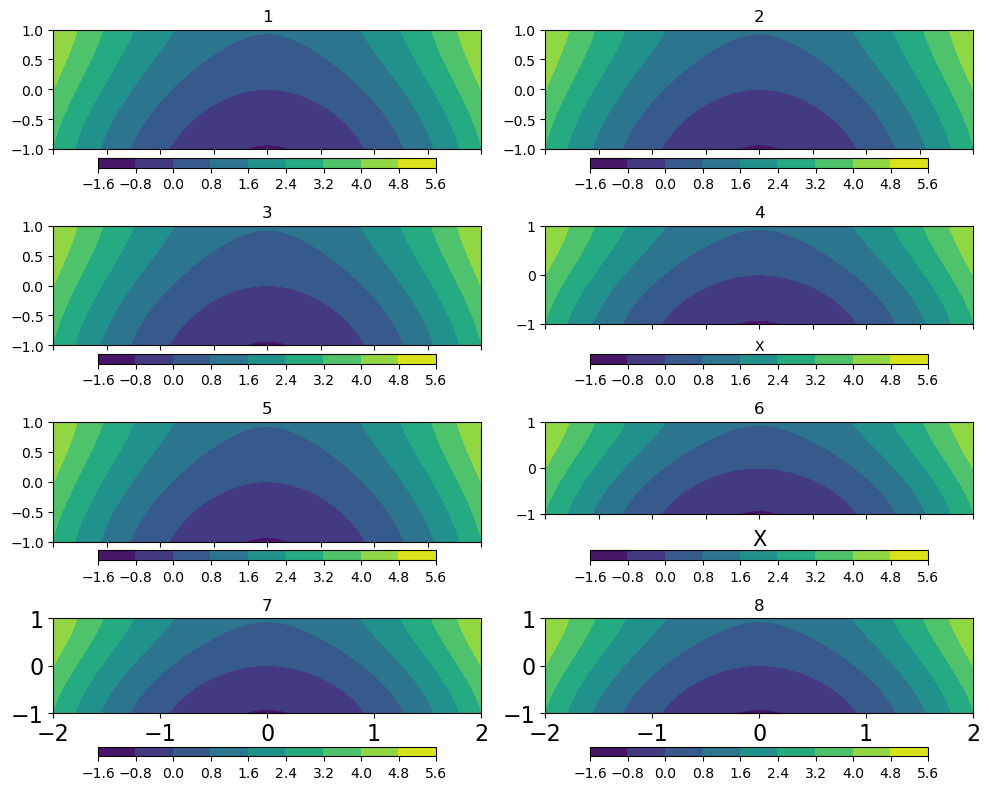
Some more explanations
The basic idea is to compute the needed space to display the tick labels and axis labels, and use that as the required padding, so that the padding space automatically adjusts to a suitable value.
That needed space is obtained by computing the y- coordinate (for a
vertically orientated colorbar, the x- coordinate)
difference between the lower left corner of the bounding box of the
main plotting area (b1), and that of the axis object (b2).
These 2 boxes are obtained using:
b1 = ax.patch.get_extents()
b2 = ax.get_tightbbox(renderer)
The return value is something like this:
Bbox(x0=125.0, y0=570.0869565217391, x1=477.27272727272725, y1=704.0)
Those numbers are coordinates of a rectangle, measured in display coordinate, or, using the matplotlib term, display transform, in units of pixels.
We then need to convert those into axis transform, using:
bbox = ax.transAxes.inverted().transform([b1.p0, b2.p0])
Coordinates in axis transform are measured in proportions of the
axis object size, e.g. 0.2 means 20 % of the axis length/width.
Lastly, the (vertical) pad is the absolute difference of the y-coordinates:
pad = abs(bbox[0]-bbox[1])[1] + base_pad
If the colorbar is vertical, the pad is the x- coordinate difference.
Another note:
I noticed that the padding value is incorrect if the axis has an
aspect ratio other than 'auto', therefore I temporally set the
aspect to 'auto' before querying the renderer:
aspect = ax.get_aspect()
ax.set_aspect('auto')
and restore it afterwards:
ax.set_aspect(aspect)
One last note:
The axis object for the colorbar is created using the
make_axes_gridspec() function. Another similar function is
make_axes(), which won’t work well with the tight_layout()
adjustment, therefore the former is preferred here.