The problem
Most of the time when one creates a plot in matplotlib, whether it
being a line plot using plot(), scatter plot using scatter(), 2D
plot using imshow() or contour(), matplotlib will automatically
tick the x- and y- axes and add the tick labels at reasonable
intervals. However, there might be times when you want to alter some
specific tick labels, with a different numerical value, or even a
different string.
Here is a stackoverflow question asking specifically how to Modify tick label text.
To set up the context and help formulate the question, consider this simple case:
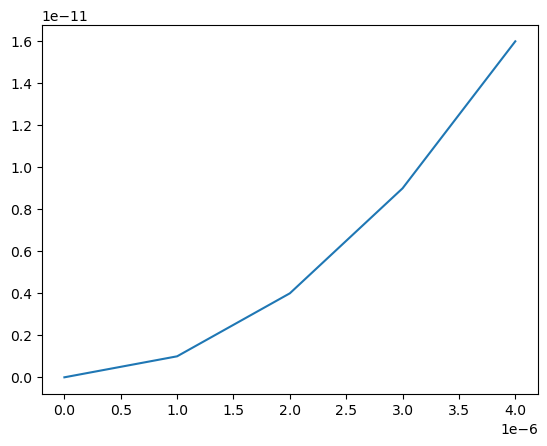
import numpy as np
import matplotlib.pyplot as plt

x = np.arange(5)/1e6
y = x**2

fig, ax = plt.subplots()
ax.plot(x, y)
fig.show()
It draws a line plot of the parabola y = x^2, as shown below in
Figure 1.
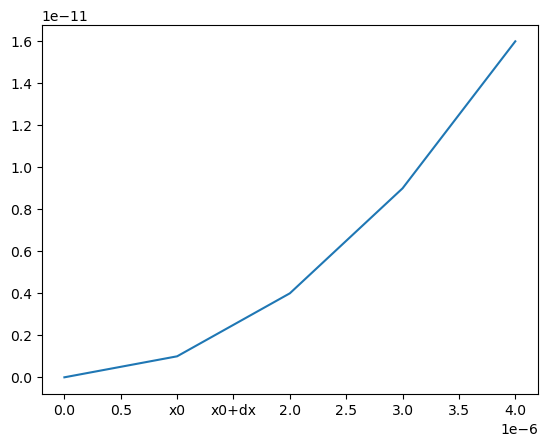
Suppose we want to change the tick label at position x = 1.0 to
x0, and that at x = 1.5 to x0 + dx. This is how one would do it
as suggested by the most voted solution in that
stackoverflow post:
fig, ax = plt.subplots()
ax.plot(x, y)
fig.canvas.draw()
labels = [item.get_text() for item in ax.get_xticklabels()]
labels[3] = 'x0'
labels[4] = 'x0+dx'
ax.set_xticklabels(labels)
fig.show()
The result is shown in Figure 2.
set_xticklabels() approach as suggested by a stackoverflow answer. Note that the scaling factor of 1e-6 is gone.The fig.canvas.draw() line is necessary because the strings for the
tick labels won’t be updated unless explicitly told to. Without this
line, the return value of ax.get_xticklabels() will be a list of
empty strings, same as the labels list.
However, you might have noticed that something is missing in this
solution. The scaling factor of 1e-6, or, using matplotlib‘s
terminology, the offset next to the x-axis, is missing.
My proposed solution
Below is my proposed solution:
def changeLabels(axis, pos, newlabels):
'''Change specific x/y tick labels
Args:
axis (Axis): .xaxis or .yaxis obj.
pos (list): indices for labels to change.
newlabels (list): new labels corresponding to indices in <pos>.
'''
if len(pos) != len(newlabels):
raise Exception("Length of <pos> doesn't equal that of <newlabels>.")
ticks = axis.get_majorticklocs()
# get the default tick formatter
formatter = axis.get_major_formatter()
# format the ticks into strings
labels = formatter.format_ticks(ticks)
# Modify specific labels
for pii, lii in zip(pos, newlabels):
labels[pii] = lii
# Update the ticks and ticklabels. Order is important here.
# Need to first get the offset:
offset = formatter.get_offset()
# Then set the modified labels:
axis.set_ticklabels(labels)
# In doing so, matplotlib creates a new FixedFormatter and sets it to the xaxis
# and the new FixedFormatter has no offset. So we need to query the
# formatter again and re-assign the offset:
axis.get_major_formatter().set_offset_string(offset)
return
fig, ax = plt.subplots()
ax.plot(x, y)
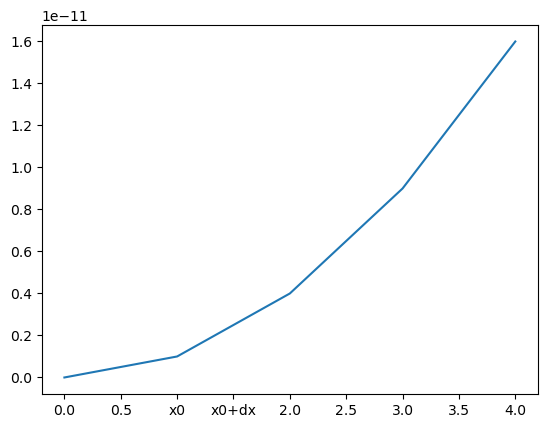
changeLabels(ax.xaxis, [3, 4], ['x0', 'x0+dx'])
fig.show()
The result is shown in Figure 3:
More explanations
A bit of more explanations:
The ticking and labeling of the axes in a matplotlib plot are handled
by the ticker class. There are 2 folds of the task: 1) the Locator
class handles the positioning of the ticks, and 2) the Formatter
class provides formatted strings as tick labels.
There are a number of different Formatters, including the
FixedFormatter, which is the default one, and the FuncFormatter, that
accepts a user-defined custom formatting function.
Normally, the locating of the ticks and formatting of the labels are
all done behind the scene, when one draws the plot using plt.show()
or figure.show(). We are now re-doing these inside the
changeLabels() function.
Firstly, get the tick values:
ticks = axis.get_majorticklocs()
This is a numpy.ndarray, with values:
[-5.0e-07  0.0e+00  5.0e-07  1.0e-06  1.5e-06  2.0e-06  2.5e-06  3.0e-06
  3.5e-06  4.0e-06  4.5e-06]
At this point, it might be tempting to get the string representation by simply using:
labels = [str(ii) for ii in ticks]
Don’t do this. Unless you have a nice and simple integer array of ticks, this is what you would get from an array of floats:
['-5e-07', '0.0', '5e-07', '1.0000000000000002e-06',
 '1.5e-06', '2e-06', '2.5e-06', '3e-06', '3.5e-06',
 '4e-06', '4.499999999999999e-06']
This is exactly what the Formatter class is designed to do. We query
the default one from the input axis object, which in this case is
an XAxis:
formatter = axis.get_major_formatter()
And use it to format the ticks:
labels = formatter.format_ticks(ticks)
This labels is a Python list, with values:
['−0.5', '0.0', '0.5', '1.0', '1.5', '2.0', '2.5', '3.0', '3.5', '4.0', '4.5']
This time we get nicely formatted string representations of the
floats. Except that the order of magnitude has been set to 1. This
is because these values are to be scaled by the offset, which is
1e-6.
To get the offset:
offset = formatter.get_offset()
NOTE that this has to be done before we assign the modified tick labels using the following:
for pii, lii in zip(pos, newlabels):
    labels[pii] = lii

axis.set_ticklabels(labels)
This is because the axis.set_ticklabels() function will create a new
FixedFormatter object internally, and assign it to the axis
object. This new FixedFormatter has no offset attribute with
it. This is why the stackoverflow solution as shown in Figure 2 is
wrong, and is also the reason why we need to record the original
offset before calling set_ticklabels().
Lastly, after updating the labels, the original offset is
re-assigned:
axis.get_major_formatter().set_offset_string(offset)