What’s this?
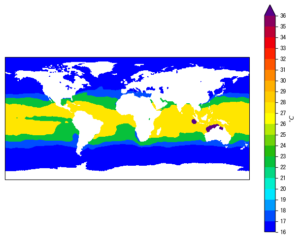
Gplot is a (thin) wrapper around matplotlib, basemap and cartopy for
quick and easy creations of geographical plots. It is designed to
create (almost) publish-ready figures with as few lines as possible, while
preserving the possibility to fine-tune various aspects of the plots.
It is hosted at https://github.com/Xunius/gplot, and documentation here: https://gplot.readthedocs.io/en/latest/.
The creation of gplot
A few years ago, I switched from the vcs module of the CDAT package to the
combination of matplotlib and basemap for my routine geographical
plot creations. The motivation behind the switch is
that vcs felt a bit primitive to me, with some rough edges here
and there that the finished plots look not as polished as those created
by matplotlib. For instance, it is a trivial task
to create a multi-line plot in matplotlib, you just call the
plt.plot() function multiple times (or plot all lines in one go). If
you add a label each time and call the plt.legend() function at the
end, you get a legend created for you, labeling all the lines in the
plot.
To do the same thing in vcs is, however, miserably
difficult. Calling the xvsy() function multiple times results in a
mere superimposition of all the individual line plots onto the same
canvas. By "mere superimposition" I literally meant it: all the line
plots will have their own x- and y- axis extents (in matplotlib
term, xlim and ylim) so that they won’t be aligned up to the same
grid, and all the x- and y- axes ticks and labels are overlapping each
other. All curves have the same color unless explicitly specified, and
the legend will be put at the same location in the graph so that they
all overlap with each other. It is totally unreadable, let alone
publish-ready.
To be fair, vcs is more suited for creating geographical plots, but
even those are less polished in my opinion. And often I needs to
combine geographical plots with simple line plots in a single figure,
as subplots, for instance, so I can’t easily use vcs for the former
and matplotlib for the latter in a single graph.
So I made the switch to the matplotlib-basemap combo, and found it
considerably easier in almost every aspect of my routine plot creation
practices.
However, over time, I started to notice some inconveniences embedded
in the matplotlib-basemap workflow. For instance, the API is a bit confusing
regarding axis controls; colorbar placement can be a bit tricky,
particularly if you want to achieve good spacings between plot
elements (I have another post talking about this aspect); the map creation in basemap() requires too many lines. I
recently discovered the proplot module and found that the author of
which has made a pretty comprehensive summary of the "rough edges" of
matplotlib, and I share many of the views with him.
To overcome the difficulties I encountered, I wrote some wrapper
classes and functions in my spare time to help ease my everyday plot
creation routines. In doing so, I did borrow the data-method-canvas
syntax from vcs to form the gplot’s basic plotting syntax:
Plot2D(data, method, axis)
Where data is the input array – what to plot,
method is the plotting method – how to plot, and axis the
matplotlib axis object – where to plot.
The number of classes and functions grow over time, as I discovered more problems, I added more patches or new things to the collection, so a module-sized thing gradually came into being.
Then I decided maybe it would be not too bad an idea to properly format this thing into a module and share it. It started as a very personal little toolbox, but maybe it would also make sense to someone else, maybe someone else will find my creation useful as well.
So I spent about 2 weeks’ time clearing up the codes and reformatting
things. And spent a few more days writing documentations
etc.. Although still regarded as in early alpha, it is now on Github,
and installable via conda:
conda install -c guangzhi gplot
What’s next
Considering the current user base of gplot is more or less just me
myself, I will just keep on using it as a personal tool, making
amendments here and there when needed. But I’m open to feature requests
and code contributions.
It is planned to use cartopy as the default "backend" for
geographical plots, as basemap has been deprecated. But cartopy still
doesn’t feel quite ready, so I’m setting it aside for now.
It is also planned to make it easier to work with netCDF data read
in by iris and xarray, but I’m not familiar with neither of them
so they are not implemented yet. If you feel this thing useful and
would like to contribute, please do!