
The issue
It is common to see in academic works contour plots, not with differently colored contour lines according to a colormap, but with black curves only. In such monochromatic contour plots, one needs to provide some alternative mechanisms for the readers to read the contour levels, such as labelling out the contours. This can be achieved in matplotlib in the following manner:
cs = ax.contour(XX, YY, var, levels=levels, colors='k')
cs.clabel(inline=True, fmt='%d')
Where fmt is a formatting string, defaulted to %1.3f, or a
dictionary explicitly labeling each contour level, or it can be any
callable, such as a Formatter instance, that returns a string when
called with a numeric contour level. Most of the time, one has to
provide a suitable format depending on the magnitudes of the data
being plotted.
But that is extra efforts, and I’m too lazy. Wouldn’t it make sense
for the fmt keyword argument to default to None, and let the function
automatically format the contour levels into strings? After all, that
is what happens to the axis ticklabels. So there must be relevant
functionalities already existing inside matplotlib. And that’s what
this post is aimed to solve.
The solution
Code first:
def labelContours(ax, cs, fmt=None, bbox=False, bbox_color='w'):
    '''Automatically label contour lines

    Args:
        ax (plt axis obj): axis obj which creates the contour plot.
        cs (mappable obj): return value of the contour() function.
    Keyword Args:
        fmt (str or dict or None): A format string for the label, e.g. '%1.3f'.
            Alternatively, this can be a dictionary matching contour levels
            with arbitrary strings to use for each contour level
            (i.e., fmt[level]=string), or it can be any callable, such as a
            Formatter instance, that returns a string when called with a
            numeric contour level. If None (the default), automatically format
            the labels using a ScalarFormatter.
        bbox (bool): whether to plot a bounding box around the labels.
        bbox_color (str or color tuple): if <bbox> is True, the background
            color of the bounding box.
    '''

    from matplotlib import ticker

    if fmt is None:
        # save the old xaxis formatter
        old_formatter = ax.xaxis.get_major_formatter()
        # get a new scalar formatter
        formatter = ticker.ScalarFormatter()
        # for some reason one needs to set as major and call format_ticks()
        # before this thing can do formatter(value)
        ax.xaxis.set_major_formatter(formatter)
        formatter.format_ticks(cs.levels)
        clabels = cs.clabel(inline=1, fmt=formatter)
        # restore old xaxis formatter
        ax.xaxis.set_major_formatter(old_formatter)
    else:
        clabels = cs.clabel(inline=1, fmt=fmt)

    if bbox:
        [txt.set_bbox(dict(facecolor=bbox_color,
                           edgecolor='none', pad=0)) for txt in clabels]

    return
More explanations
The fmt kwarg to the labelContours() function is the same as that
to the clabel() function, except that it is defaulted to None. In
such cases, our automatic formatting procedure is triggered,
otherwise, it will be passed directly to clabel(), using
clabels = cs.clabel(inline=1, fmt=fmt)
The trick of the automatic formatting is to use a
matplotlib.ticker.ScalarFormatter object, which is used when
formatting the default axes ticklabels.
We create one such ScalarFormatter using:
formatter = ticker.ScalarFormatter()
Then we call its format_ticks() method to derive the labels in
string formats:
formatter.format_ticks(cs.levels)
However, there is a catch. For some reason, format_ticks(cs.levels)
won’t output anything, unless the formatter is first assigned to an
axis, like this:
ax.xaxis.set_major_formatter(formatter)
In order to avoid any possible side effects, we first save the old
formatter associated with the xaxis, and restore it afterwards:
old_formatter = ax.xaxis.get_major_formatter()
...
ax.xaxis.set_major_formatter(old_formatter)
That’s pretty much all about this trick.
Example
Code first:
from __future__ import print_function
import numpy as np
import matplotlib.pyplot as plt

def mkscale(n1, n2, nc=12, zero=1):
    '''Copied from vcs/util.py

    Function: mkscale

    Description of function:
    This function return a nice scale given a min and a max

    option:
    nc # Maximum number of intervals (default=12)
    zero # Not all implemented yet so set to 1 but values will be:
           -1: zero MUST NOT be a contour
            0: let the function decide # NOT IMPLEMENTED
            1: zero CAN be a contour  (default)
            2: zero MUST be a contour
    Examples of Use:
    >>> vcs.mkscale(0,100)
    [0.0, 10.0, 20.0, 30.0, 40.0, 50.0, 60.0, 70.0, 80.0, 90.0, 100.0]
    >>> vcs.mkscale(0,100,nc=5)
    [0.0, 20.0, 40.0, 60.0, 80.0, 100.0]
    >>> vcs.mkscale(-10,100,nc=5)
    [-25.0, 0.0, 25.0, 50.0, 75.0, 100.0]
    >>> vcs.mkscale(-10,100,nc=5,zero=-1)
    [-20.0, 20.0, 60.0, 100.0]
    >>> vcs.mkscale(2,20)
    [2.0, 4.0, 6.0, 8.0, 10.0, 12.0, 14.0, 16.0, 18.0, 20.0]
    >>> vcs.mkscale(2,20,zero=2)
    [0.0, 2.0, 4.0, 6.0, 8.0, 10.0, 12.0, 14.0, 16.0, 18.0, 20.0]

    '''
    if n1 == n2:
        return [n1]
    import numpy
    nc = int(nc)
    cscale = 0  # ???? May be later
    min = numpy.min([n1, n2])
    max = numpy.max([n1, n2])
    if zero > 1.:
        if min > 0.:
            min = 0.
        if max < 0.:
            max = 0.
    rg = float(max-min)  # range
    delta = rg/nc  # basic delta
    # scale delta to be >10 and <= 100
    lg = -numpy.log10(delta)+2.
    il = numpy.floor(lg)
    delta = delta*(10.**il)
    max = max*(10.**il)
    min = min*(10.**il)
    if zero > -0.5:
        if delta <= 20.:
            delta = 20
        elif delta <= 25.:
            delta = 25
        elif delta <= 40.:
            delta = 40
        elif delta <= 50.:
            delta = 50
        elif delta <= 60.:
            delta = 60
        elif delta <= 70.:
            delta = 70
        elif delta <= 80.:
            delta = 80
        elif delta <= 90.:
            delta = 90
        elif delta <= 101.:
            delta = 100
        first = numpy.floor(min/delta)-1.
    else:
        if delta <= 20.:
            delta = 20
        elif delta <= 25.:
            delta = 25
        elif delta <= 40.:
            delta = 40
        elif delta <= 50.:
            delta = 50
        elif delta <= 60.:
            delta = 60
        elif delta <= 70.:
            delta = 70
        elif delta <= 80.:
            delta = 80
        elif delta <= 90.:
            delta = 90
        elif delta <= 101.:
            delta = 100
        first = numpy.floor(min/delta)-1.5

    scvals = delta*(numpy.arange(2*nc)+first)
    a = 0
    for j in range(len(scvals)):
        if scvals[j] > min:
            a = j-1
            break
    b = 0
    for j in range(len(scvals)):
        if scvals[j] >= max:
            b = j+1
            break
    if cscale == 0:
        cnt = scvals[a:b]/10.**il
    else:
        # not done yet...
        raise Exception('ERROR scale not implemented in this function')
    return list(cnt)


def labelContours(ax, cs, fmt=None, bbox=True, bbox_color='w'):
    '''Automatically label contour lines

    Args:
        ax (plt axis obj): axis obj which creates the contour plot.
        cs (mappable obj): return value of the contour() function.
    Keyword Args:
        fmt (str or dict or None): A format string for the label, e.g. '%1.3f'.
            Alternatively, this can be a dictionary matching contour levels
            with arbitrary strings to use for each contour level
            (i.e., fmt[level]=string), or it can be any callable, such as a
            Formatter instance, that returns a string when called with a
            numeric contour level. If None (the default), automatically format
            the labels using a ScalarFormatter.
        bbox (bool): whether to plot a bounding box around the labels.
        bbox_color (str or color tuple): if <bbox> is True, the background
            color of the bounding box.
    '''

    from matplotlib import ticker

    if fmt is None:
        # save the old xaxis formatter
        old_formatter = ax.xaxis.get_major_formatter()
        # get a new scalar formatter
        formatter = ticker.ScalarFormatter()
        # for some reason one needs to set as major and call format_ticks()
        # before this thing can do formatter(value)
        ax.xaxis.set_major_formatter(formatter)
        formatter.format_ticks(cs.levels)
        clabels = cs.clabel(inline=1, fmt=formatter)
        # restore old xaxis formatter
        ax.xaxis.set_major_formatter(old_formatter)
    else:
        clabels = cs.clabel(inline=1, fmt=fmt)

    if bbox:
        [txt.set_bbox(dict(facecolor=bbox_color,
                           edgecolor='none', pad=0)) for txt in clabels]

    return


# -------------Main---------------------------------
if __name__ == '__main__':

    # create sample data
    x = np.linspace(-5, 5, 100)
    y = np.linspace(-5, 5, 100)
    XX, YY = np.meshgrid(x, y)
    z = XX**2 + (YY-3)**2

    figure, axes = plt.subplots(
        figsize=(12, 10),
        nrows=2, ncols=2, sharex=True, sharey=True)

    for ii, axii, varii, titleii in zip(
        range(4),
        axes.flat, [z, z / 1e3, z, z / 1e3],
        ['(a) var = z; fmt = "%d"', '(b) var = z/1e3; fmt = "%.2f"',
         '(c) var = z; auto format', '(d) var = z/1e3; auto format, bbox']):

        levelsii = mkscale(np.nanmin(varii), np.nanmax(varii), 10)
        cs = axii.contour(XX, YY, varii, levels=levelsii, colors='k')
        axii.set_title(titleii, loc='left')

        if ii == 0:
            cs.clabel(inline=True, fmt='%d')
        elif ii == 1:
            cs.clabel(inline=True, fmt='%.3f')
        elif ii == 2:
            labelContours(axii, cs, fmt=None, bbox=False)
        elif ii == 3:
            labelContours(axii, cs, fmt=None, bbox=True, bbox_color='0.8')

    figure.tight_layout()
    figure.show()
The output is:
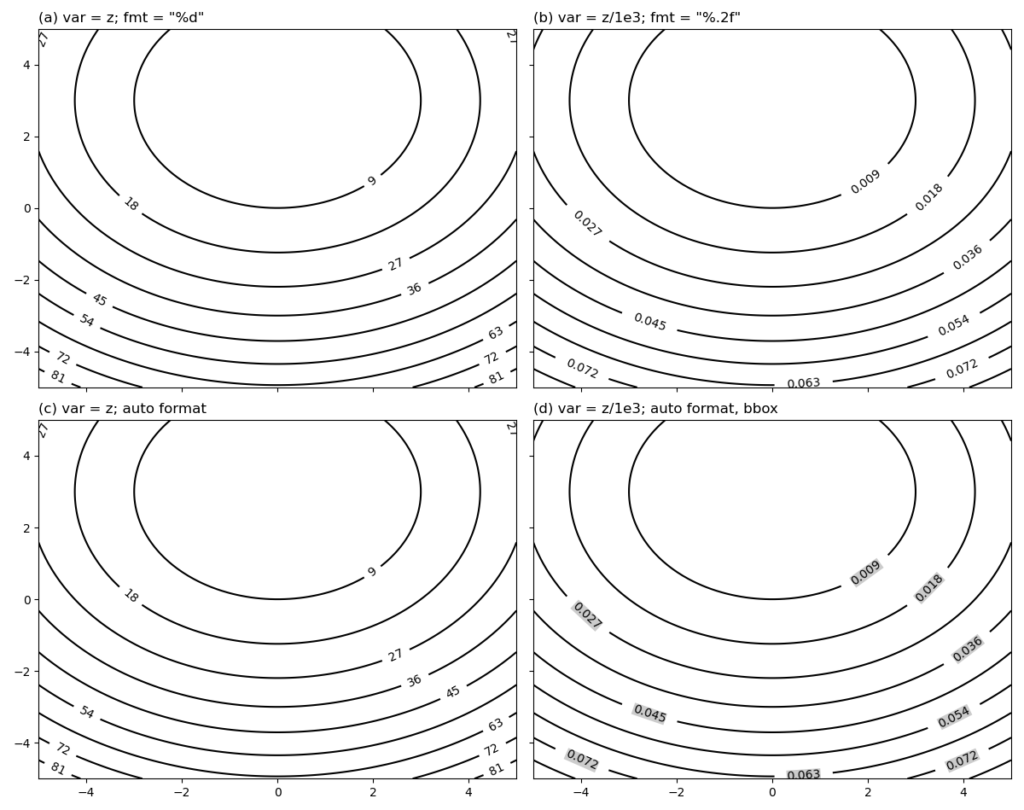
A few points to note:
- subplot (a) and (b) use prescribed formatting strings (
"%d"and"%.3f", respectively), for data with different orders magnitudes (zandz/1e3, respectively). - subplot (c) calls the
labelContours()function introduced above, without a bounding box. It appropriately formats the labels to integers. - subplot (d) calls the
labelContours()function introduced above, with a grey bounding box. It appropriately formats the labels to floats with 3 decimal places, for the data that have been scaled down by 3 orders of magnitudes. - the
mkscale()function is used to automatically derive a set of nice-looking contour levels, given the range of the data, and a desired number of levels. More on this is discussed in this post.

Hello,
I’m trying to add a backgroud color to my contour’s labels, as for the lower right corner of the figure.
But not working. The error :
[txt.set_bbox(dict(facecolor=bbox_color,
TypeError: ‘NoneType’ object is not iterable
I’m using spyder with Python 3.9.7
Can you try to look around on what is going on plz ??
Fernand
Hi Fernand
Could you let me know did you used the original code in the post, or used your own data?
I’m guessing that the `NoneType` object in the error messages is the `clabel` object. Then it implies that no contours get plotted out in the first place.
If your plotting script is not too complicated, maybe you could email a copy to me and let me have a look? (address: xugzhi1987 “at” gmail.com).
Regards